Consider the diagram in Problem 30-4, and answer the following questions. a. Suppose that a new technology
Question:
Consider the diagram in Problem 30-4, and answer the following questions.
a. Suppose that a new technology for reducing water pollution generates a reduction in the marginal cost of pollution abatement at every degree of water cleanliness. After this event occurs, will the optimal percentage degree of water cleanliness rise or fall? Will the cost incurred for the last unit of water cleanup increase or decrease? Provide a diagram to assist in your explanation.
b. Suppose that the event discussed in part (a) occurs and that, in addition, medical studies determine that the marginal benefit from water pollution abatement is higher at every degree of water cleanliness. Following both events, will the optimal percentage degree of water cleanliness increase or decrease? In comparison with the initial optimum, can you determine whether the cost incurred for the last unit of water cleanup will increase or decrease? Use a new diagram to assist in explaining your answers.
Problem 30-4
Consider the following diagram, which displays the marginal cost and marginal benefit of water pollution abatement in a particular city, and answer the following questions.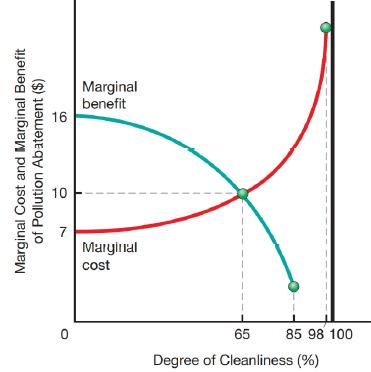
Step by Step Answer: