

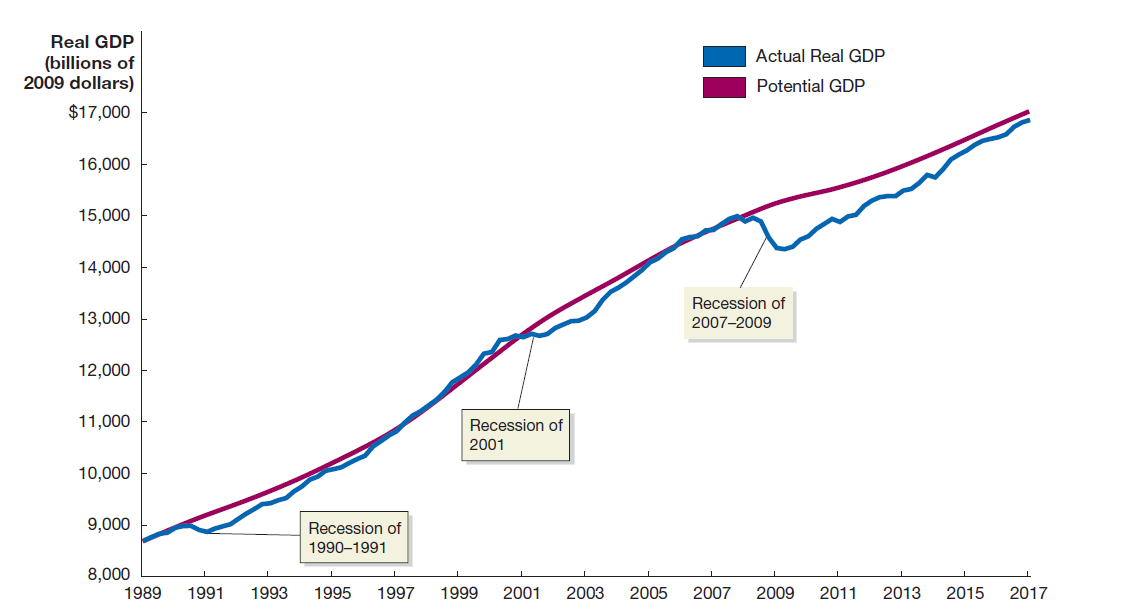
Figure 21.2 on page 712 shows that the growth of potential GDP slowed following the recession of
Question:
Figure 21.2 on page 712 shows that the growth of potential GDP slowed following the recession of 2007–2009. Use the data in the following table to discuss how movements in potential GDP can be explained by the analysis in this chapter.
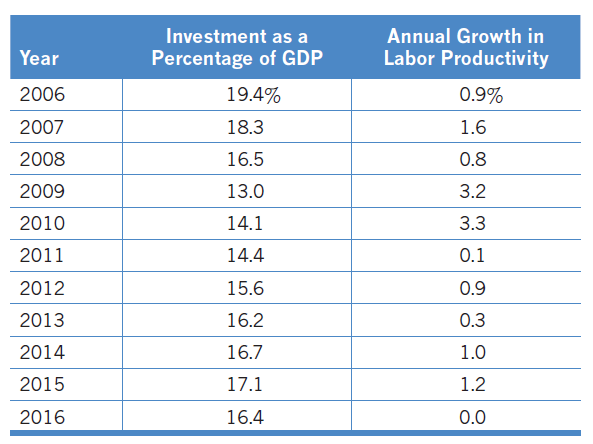
Figure 21.2
Fantastic news! We've Found the answer you've been seeking!
Step by Step Answer:
After the Great Recession investment became a s...View the full answer

Answered By
PALASH JHANWAR
I am a Chartered Accountant with AIR 45 in CA - IPCC. I am a Merit Holder ( B.Com ). The following is my educational details.
PLEASE ACCESS MY RESUME FROM THE FOLLOWING LINK: https://drive.google.com/file/d/1hYR1uch-ff6MRC_cDB07K6VqY9kQ3SFL/view?usp=sharing
3+ Reviews
10+ Question Solved
Related Book For 

Question Posted:
