

The diagram shows part of the graph of y = f(x). It crosses the x-axis at A(120,
Question:
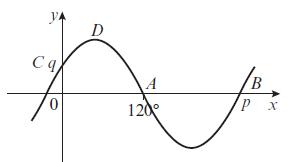
The diagram shows part of the graph of y = f(x).
It crosses the x-axis at A(120°, 0) and B(p, 0).
It crosses the y-axis at C (0, q) and has a maximum value at D, as shown.
Given that f(x) = sin (x + k), where k > 0, write down
a. The value of p
b. The coordinates of
c. The smallest value of k
d. The value of q.
Fantastic news! We've Found the answer you've been seeking!
Step by Step Answer:
a The value of p can be determined from the graph We can see that the point B lies on the xaxis whic...View the full answer

Answered By
Deepak Sharma
0 Reviews
10+ Question Solved
Related Book For 

Edexcel AS And A Level Mathematics Pure Mathematics Year 1/AS
ISBN: 9781292183398
1st Edition
Authors: Greg Attwood
Question Posted:
