

The following diagram shows a sketch of the curve with equation y = f(x). The points A(0,
Question:
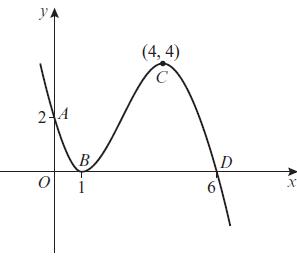
The following diagram shows a sketch of the curve with equation y = f(x). The points A(0, 2), B(1, 0), C(4, 4) and D(6, 0) lie on the curve.
Sketch the following graphs and give the coordinates of the points, A, B, C and D after each transformation:
a. f(x + 1)
b. f(x) − 4
c. f(x + 4)
d. f(2x)
e. 3f(x)
f. f(1/2x)g. 1/2f(x)
h. f(−x)
Fantastic news! We've Found the answer you've been seeking!
Step by Step Answer:
To perform transformations on the function fx and describe the impact on the points A0 2 B1 0 C4 4 ...View the full answer

Answered By
Joan Gakii
I'm a meticulous professional writer with over five years writing experience. My skill set includes
- Digital Content,
- Interpersonal Communication,
- Web Content and academic Writing,
- Proofreading,
- Editing,
- Project Management, and
- Public Relations.
7+ Reviews
12+ Question Solved
Related Book For 

Edexcel AS And A Level Mathematics Pure Mathematics Year 1/AS
ISBN: 9781292183398
1st Edition
Authors: Greg Attwood
Question Posted:
