

The scatter graph shows the height h and foot length f of 8 students. A line of
Question:
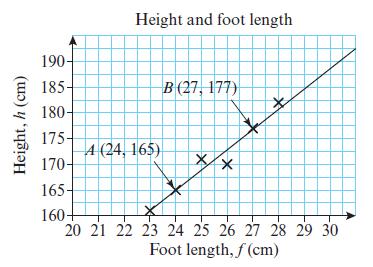
The scatter graph shows the height h and foot length f of 8 students. A line of best fit is drawn on the scatter graph.
a. Explain why the data can be approximated to a linear model.
b. Use points A and B on the scatter graph to write a linear equation in the form h = af + b.
c. Calculate the expected height of a person with a foot length of 26.5 cm.
Fantastic news! We've Found the answer you've been seeking!
Step by Step Answer:
a The data can be approximated to a linear model because the scatter graph shows a trend where the h...View the full answer

Answered By
Ali Khawaja
my expertise are as follows: financial accounting : - journal entries - financial statements including balance sheet, profit & loss account, cash flow statement & statement of changes in equity -consolidated statement of financial position. -ratio analysis -depreciation methods -accounting concepts -understanding and application of all international financial reporting standards (ifrs) -international accounting standards (ias) -etc business analysis : -business strategy -strategic choices -business processes -e-business -e-marketing -project management -finance -hrm financial management : -project appraisal -capital budgeting -net present value (npv) -internal rate of return (irr) -net present value(npv) -payback period -strategic position -strategic choices -information technology -project management -finance -human resource management auditing: -internal audit -external audit -substantive procedures -analytic procedures -designing and assessment of internal controls -developing the flow charts & data flow diagrams -audit reports -engagement letter -materiality economics: -micro -macro -game theory -econometric -mathematical application in economics -empirical macroeconomics -international trade -international political economy -monetary theory and policy -public economics ,business law, and all regarding commerce
1+ Reviews
10+ Question Solved
Related Book For 
Edexcel AS And A Level Mathematics Pure Mathematics Year 1/AS
ISBN: 9781292183398
1st Edition
Authors: Greg Attwood
Question Posted:
