

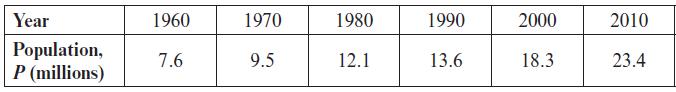
The table below shows the population of Mozambique between 1960 and 2010. This data can be modelled
Question:
The table below shows the population of Mozambique between 1960 and 2010.
This data can be modelled using an exponential function of the form P = abt, where t is the time in years since 1960 and a and b are constants.
a. Copy and complete the table below.
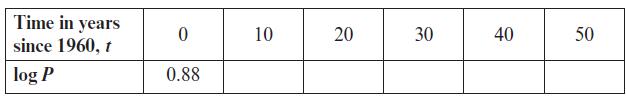
b. Show that P = abt can be rearranged into the form log P = log a + t log b.
c. Plot a graph of log P against t using the values from your table and draw in a line of best fit.
d. Use your graph to estimate the values of a and b.
e. Explain why an exponential model is often appropriate for modelling population growth.
Step by Step Answer:

This question has not been answered yet.
You can Ask your question!
Related Book For 

Edexcel AS And A Level Mathematics Pure Mathematics Year 1/AS
ISBN: 9781292183398
1st Edition
Authors: Greg Attwood
Question Posted:
