

Question: 2.50 Skillbuilder Applet Exercise demonstrates the effect that the number of classes or bins has on the shape of a histogram. a. What shape distribution
2.50 Skillbuilder Applet Exercise demonstrates the effect that the number of classes or bins has on the shape of a histogram.
a. What shape distribution does using one class or bin produce?
b. What shape distribution does using two classes or bins produce?
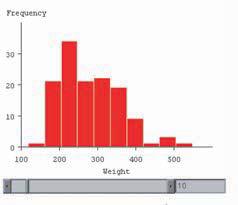
c. What shape distribution does using 10 or 20 bins produce?
Frequency 30 20 20 10 100 200 300 400 500 Weight 10
Step by Step Solution
There are 3 Steps involved in it
1 Expert Approved Answer
Step: 1 Unlock

Question Has Been Solved by an Expert!
Get step-by-step solutions from verified subject matter experts
Step: 2 Unlock
Step: 3 Unlock