

Question: A sample of 32 students took a class designed to improve their SAT math scores. Following are their scores before and after the class. Can
A sample of 32 students took a class designed to improve their SAT math scores. Following are their scores before and after the class.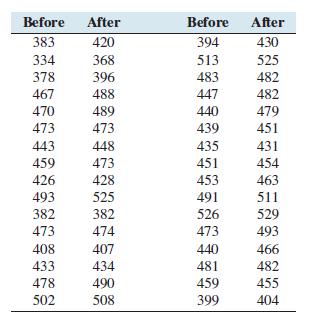
Can you conclude that the mean increase in score is less than 15 points?
a. State the null and alternate hypotheses.
b. Compute the test statistic.
c. State a conclusion. Use the α = 0.05 level of significance.
Before After Before After 383 420 394 430 334 368 513 525 378 396 483 482 467 488 447 482 470 489 440 479 473 473 439 451 443 448 435 431 459 473 451 454 426 428 453 463 493 525 491 511 382 382 526 529 473 474 473 493 408 407 440 466 433 434 481 482 478 490 459 455 502 508 399 404
Step by Step Solution
3.40 Rating (156 Votes )
There are 3 Steps involved in it

Get step-by-step solutions from verified subject matter experts