

Question: Bonferroni Test Shown below are partial results from using the Bonferroni test with the sample data from Exercise 13. Assume that a 0.05 significance level
Bonferroni Test Shown below are partial results from using the Bonferroni test with the sample data from Exercise 13.
Assume that a 0.05 significance level is being used.
a. What do the displayed results tell us?
b. Use the Bonferroni test procedure to test for a significant difference between the mean amount of the irrigation treatment group and the group treated with both fertilizer and irrigation. Identify the test statistic and either the P-value or critical values. What do the results indicate?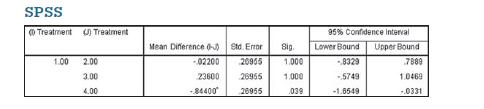
SPSS Treatment Treatment 95% Confidence interval Mean Difference (-) Std. Error Sig. Lower Bound Upper Bound 1.00 2.00 3.00 -02200 20965 1.000 -8329 7889 23600 26955 1.000 -5749 1.0469 4.00 -84400 26955 039 -1.6549 -.0331
Step by Step Solution
There are 3 Steps involved in it

Get step-by-step solutions from verified subject matter experts