

Question: Credit data were collected on a random sample of 25 U.S. cities in a recent year. Following are the average credit scores, the average debt,
Credit data were collected on a random sample of 25 U.S. cities in a recent year. Following are the average credit scores, the average debt, the average number of late payments, the average percentage of credit available, and the average number of open credit cards.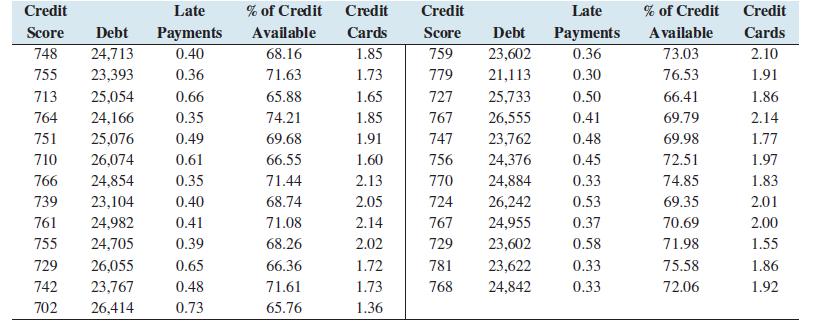
a. Let y represent average credit score, x1 represent average debt, x2 represent average number of late payments, x3 represent average percentage of credit available, and x4 represent average number of open credit cards. Construct the multiple regression equation ̂y = b0 + b1x1 + b2x2 + b3x3 + b4x4.
b. In Denver, Colorado, the average debt was $26,775, the average number of late payments was 0.42, the average percentage of available credit was 70.24, and the average number of open credit cards was 2.18. Predict the average credit score in Denver.
c. Refer to part (b). Construct a 95% confidence interval for the average credit score.
d. Refer to part (b). Construct a 95% prediction interval for the average credit score.
e. What percentage of the variation in the average credit score is explained by the model?
f. Is the model useful for prediction? Why or why not? Use the α = 0.01 level.
g. Test H0: β1 = 0 versus H1: β1 ≠ 0 at the α = 0.05 level. Can you reject H0? Repeat for β2, β3, and β4.
Credit Late % of Credit Credit Credit Late % of Credit Credit Score Debt Payments Available Cards Score Debt Payments Available Cards 748 24,713 0.40 68.16 1.85 759 23,602 0.36 73.03 2.10 755 23,393 0.36 71.63 1.73 779 21,113 0.30 76.53 1.91 713 25,054 0.66 65.88 1.65 727 25,733 0.50 66.41 1.86 764 24,166 0.35 74.21 1.85 767 26,555 0.41 69.79 2.14 751 25,076 0.49 69.68 1.91 747 23,762 0.48 69.98 1.77 710 26,074 0.61 66.55 1.60 756 24,376 0.45 72.51 1.97 766 24,854 0.35 71.44 2.13 770 24,884 0.33 74.85 1.83 739 23,104 0.40 68.74 2.05 724 26,242 0.53 69.35 2.01 761 24,982 0.41 71.08 2.14 767 24,955 0.37 70.69 2.00 755 24,705 0.39 68.26 2.02 729 23,602 0.58 71.98 1.55 729 26,055 0.65 66.36 1.72 781 23,622 0.33 75.58 1.86 742 23,767 0.48 71.61 1.73 768 24,842 0.33 72.06 1.92 702 26,414 0.73 65.76 1.36
Step by Step Solution
3.44 Rating (157 Votes )
There are 3 Steps involved in it

Get step-by-step solutions from verified subject matter experts