

Question: Discuss the relationship between the side-byside dotplots drawn in question 3 and the scatter diagram drawn in question 8. Asking Asking Asking Asking Asking Year
Discuss the relationship between the side-byside dotplots drawn in question 3 and the scatter diagram drawn in question 8.
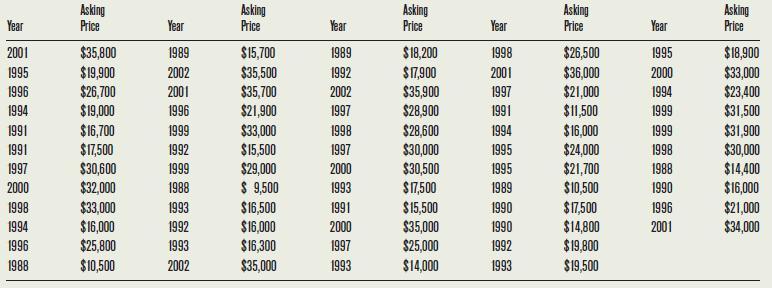
Asking Asking Asking Asking Asking Year Price Year Price Year Price Year Price Year Price 2001 $35,800 1989 $15,700 1989 $18,200 1998 $26,500 1995 $18,900 1995 $19,900 2002 $35,500 1992 $17,900 2001 $36,000 2000 $33,000 1996 $26,700 2001 $35,700 2002 $35,900 1997 $21,000 1994 $23,400 1994 $19,000 1996 $21,900 1997 $28,900 1991 $11,500 1999 $31,500 1991 $16,700 1999 $33,000 1998 $28,600 1994 $16,000 1999 $31,900 1991 $17,500 1992 $15,500 1997 $30,000 1995 $24,000 1998 $30,000 1997 $30,600 1999 $29,000 2000 $30,500 1995 $21,700 1988 $14,400 2000 $32,000 1988 $ 9,500 1993 $17,500 1989 $10,500 1990 $16,000 1998 $33,000 1993 $16,500 1991 $15,500 1990 $17,500 1996 $21,000 1994 $16,000 1992 $16,000 2000 $35,000 1990 $14,800 2001 $34,000 1996 $25,800 1993 $16,300 1997 $25,000 1992 $19,800 1988 $10,500 2002 $35,000 1993 $14,000 1993 $19,500
Step by Step Solution
There are 3 Steps involved in it

Get step-by-step solutions from verified subject matter experts