

Question: Each of the following histograms represents a data set with mean 20. One has a standard deviation of 3.96 and the other has a standard
Each of the following histograms represents a data set with mean 20.
One has a standard deviation of 3.96 and the other has a standard deviation of 2.28. Which is which? Fill in the blanks: Histogram I has a standard deviation of ___________________ and histogram II has a standard deviation of _________________.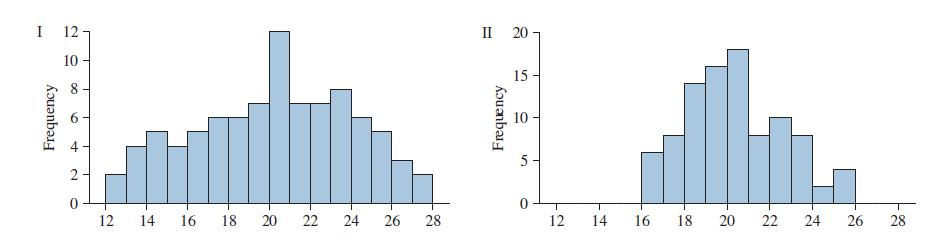
I Frequency 8- 9 12 14 16 18 II Frequency 20- 20 15- 10- 0 18. T 20 22 24 26 28 12 14 16 18 20 22 24 26 28
Step by Step Solution
★★★★★
3.41 Rating (148 Votes )
There are 3 Steps involved in it
1 Expert Approved Answer
Step: 1 Unlock

Question Has Been Solved by an Expert!
Get step-by-step solutions from verified subject matter experts
Step: 2 Unlock
Step: 3 Unlock