

Question: Expected frequencies: Compute the expected frequencies under the null hypothesis of independence. The General Social Survey polled 1280 men and 1531 women to determine their
Expected frequencies: Compute the expected frequencies under the null hypothesis of independence.
The General Social Survey polled 1280 men and 1531 women to determine their level of education. The results are presented in the following table.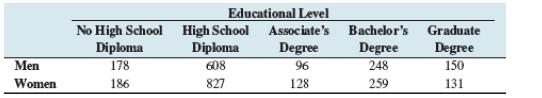
Educational Level No High School High School Associate's Bachelor's Graduate Diploma Diploma Degree Degree Degree Men 178 608 96 248 150 Women 186 827 128 259 131
Step by Step Solution
There are 3 Steps involved in it
1 Expert Approved Answer
Step: 1 Unlock

Question Has Been Solved by an Expert!
Get step-by-step solutions from verified subject matter experts
Step: 2 Unlock
Step: 3 Unlock