

Question: Finding Standard Deviation from a Frequency Distribution. In Exercises 3740, find the standard deviation of sample data summarized in a frequency distribution table by using
Finding Standard Deviation from a Frequency Distribution. In Exercises 37–40, find the standard deviation of sample data summarized in a frequency distribution table by using the formula below, where x represents the class midpoint, f represents the class frequency, and n represents the total number of sample values. Also, compare the computed standard deviations to these standard deviations obtained by using Formula 4 with the original list of data values: (Exercise 37) 11.1 years; (Exercise 38) 9.0 years; (Exercise 39) 13.4; (Exercise 40) 9.7 years.![s = [n[ (f x)] n(n - - [ (f *) ]2](https://dsd5zvtm8ll6.cloudfront.net/images/question_images/1724/1/3/8/92666c445aecc81a1724138918935.jpg)
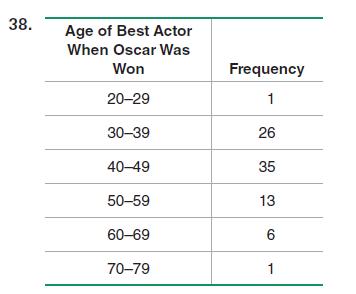
.39. Finding Standard Deviation from a Frequency Distribution. In Exercises 37–40, find the standard deviation of sample data summarized in a frequency distribution table by using the formula below, where x represents the class midpoint, f represents the class frequency, and n represents the total number of sample values. Also, compare the computed standard deviations to these standard deviations obtained by using Formula 4 with the original list of data values: (Exercise 37) 11.1 years; (Exercise 38) 9.0 years; (Exercise 39) 13.4; (Exercise 40) 9.7 years.
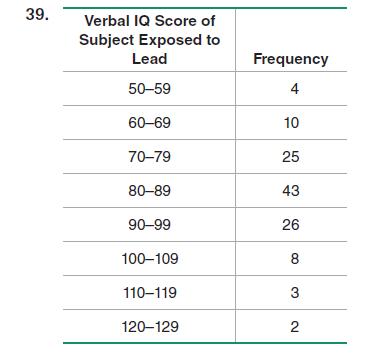
s = [n[ (f x)] n(n - - [ (f *) ]2 1) Standard deviation for frequency distribution
Step by Step Solution
There are 3 Steps involved in it

Get step-by-step solutions from verified subject matter experts