

Question: Given below is a display resulting from two-way analysis of variance with sample data consisting of 18 different student estimates of the length of a
Given below is a display resulting from two-way analysis of variance with sample data consisting of 18 different student estimates of the length of a classroom. The values are categorized according to sex and major (math, business, liberal arts). What do you conclude about an interaction between sex and major?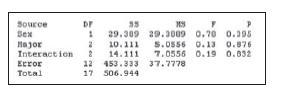
Source Sex DF Major Error Total Interaction 55 29.309 29.3009 0.70 0.395 2 10.111 5.0556 0.13 0.876 2 14.111 7.0556 0.19 0.832 12 453.333 37.7778 17 506.944
Step by Step Solution
There are 3 Steps involved in it
1 Expert Approved Answer
Step: 1 Unlock

Question Has Been Solved by an Expert!
Get step-by-step solutions from verified subject matter experts
Step: 2 Unlock
Step: 3 Unlock