

Question: In the chapter introduction, we presented gas mileage data for 2016 model year hybrid and small non-hybrid cars. We will use histograms and back-to-back stem-and-leaf
In the chapter introduction, we presented gas mileage data for 2016 model year hybrid and small non-hybrid cars. We will use histograms and back-to-back stem-and-leaf plots to compare the mileages between these two groups of cars. The following tables present the mileages, in miles per gallon.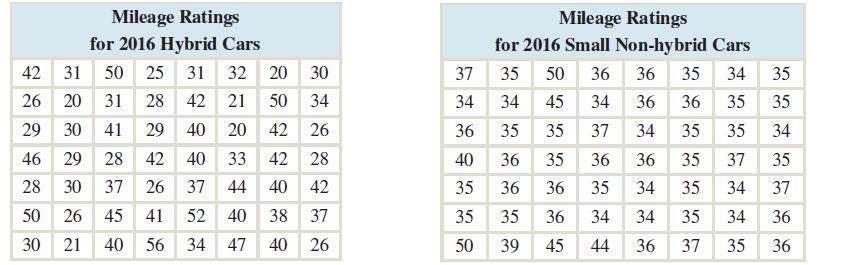
1. Construct a frequency distribution for the hybrid cars with a class width of 2.
2. Explain why a class width of 2 is too narrow for these data.
3. Construct a relative frequency distribution for the hybrid cars with a class width of 3, where the first class has a lower limit of 20.
4. Construct a histogram based on this relative frequency distribution. Is the histogram unimodal or bimodal? Describe the skewness, if any, in these data.
5. Construct a frequency distribution for the non-hybrid cars with an appropriate class width.
6. Using this class width, construct a relative frequency distribution for the non-hybrid cars.
7. Construct a histogram based on this relative frequency distribution. Is the histogram unimodal or bimodal? Describe the skewness, if any, in these data.
8. Compare the histogram for the hybrid cars with the histogram for the non-hybrid cars. For which cars do the mileages vary more?
9. Construct a back-to-back stem-and-leaf plot for these data, using two lines for each stem. Which do you think illustrates the comparison better, the histograms or the back-to-back stem-and-leaf plot? Why?
Mileage Ratings for 2016 Hybrid Cars 42 31 50 25 31 32 20 Mileage Ratings for 2016 Small Non-hybrid Cars 30 37 35 50 36 36 35 34 35 26 20 31 28 42 21 50 34 34 34 45 34 36 36 35 35 29 30 41 29 40 20 42 26 36 35 35 37 34 35 35 34 46 29 28 42 40 33 42 28 40 36 35 36 36 35 37 35 28 30 37 26 37 44 40 42 35 36 36 35 34 35 34 37 50 26 45 41 52 40 38 37 35 35 36 34 34 35 34 36 30 21 40 56 34 47 40 26 50 39 45 44 36 37 35 36
Step by Step Solution
3.44 Rating (157 Votes )
There are 3 Steps involved in it

Get step-by-step solutions from verified subject matter experts