

Question: Lake Mead Elevations Shown below are an x chart (top) and an R chart (bottom) obtained by using the monthly elevations of Lake Mead at
Lake Mead Elevations Shown below are an x chart (top) and an R chart (bottom)
obtained by using the monthly elevations of Lake Mead at Hoover Dam (based on data from the U.S. Department of the Interior). The elevations are in feet above sea level. The control charts are based on the 12 monthly elevations for each of the 75 consecutive and recent years available as of this writing. What do the control charts tell us about Lake Mead?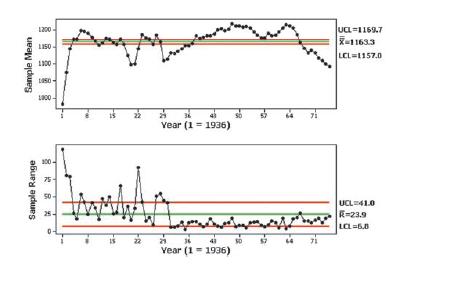
Sample Range Sample Mean 100- 75 50- 25 1200 1150- 1300- 1900- 22 29 36 Year (1 = 1936) a Year (1-1936) UCL=1169.7 1163.3 LCL=1157.0 UCL 41.0 R=23.9 LCL=6.8
Step by Step Solution
There are 3 Steps involved in it
1 Expert Approved Answer
Step: 1 Unlock

Question Has Been Solved by an Expert!
Get step-by-step solutions from verified subject matter experts
Step: 2 Unlock
Step: 3 Unlock