

Question: The 2000 census produced the following figures for the city of Loveland, Colorado, with respect to the number of available vehicles per household: Replacing the
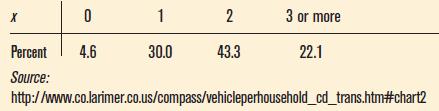
The 2000 census produced the following figures for the city of Loveland, Colorado, with respect to the number of available vehicles per household:
Replacing the category of “3 or more” with “3”:
a. Find the mean of x.
b. Find the standard deviation of x.
0 1 2 3 or more Percent 4.6 30.0 43.3 22.1 Source: http://www.co.larimer.co.us/compass/vehicleperhousehold_cd_trans.htm#chart2
Step by Step Solution
There are 3 Steps involved in it
1 Expert Approved Answer
Step: 1 Unlock

Question Has Been Solved by an Expert!
Get step-by-step solutions from verified subject matter experts
Step: 2 Unlock
Step: 3 Unlock