

Question: The accompanying normal quantile plot was obtained from the longevity times of presidents. What does this graph tell us? z score 2 1.5- 1 0.5
The accompanying normal quantile plot was obtained from the longevity times of presidents. What does this graph tell us?
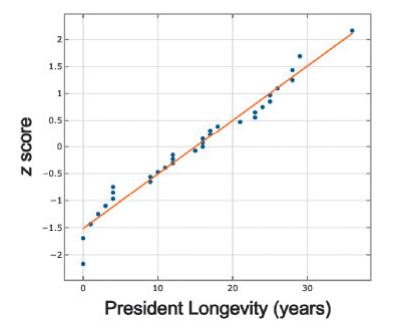
z score 2 1.5- 1 0.5 -0.5 -1.5 0 10 20 30 President Longevity (years)
Step by Step Solution
★★★★★
3.48 Rating (155 Votes )
There are 3 Steps involved in it
1 Expert Approved Answer
Step: 1 Unlock

Because the pattern of the points ... View full answer
Question Has Been Solved by an Expert!
Get step-by-step solutions from verified subject matter experts
Step: 2 Unlock
Step: 3 Unlock