

The following frequency distribution presents the batting averages of Major League Baseball players in both the American
Question:
The following frequency distribution presents the batting averages of Major League Baseball players in both the American League and the National League who had 300 or more plate appearances during a recent season.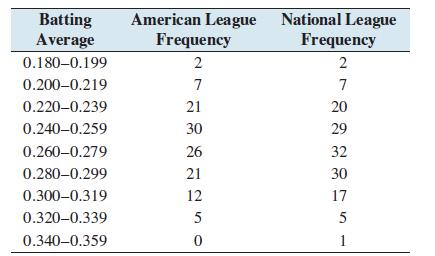
a. Construct a frequency histogram for the American League.
b. Construct a frequency histogram for the National League.
c. Construct a relative frequency distribution for the American League.
d. Construct a relative frequency distribution for the National League.
e. Construct a relative frequency histogram for the American League.
f. Construct a relative frequency histogram for the National League.
g. What percentage of American League players had batting averages of 0.300 or more?
h. What percentage of National League players had batting averages of 0.300 or more?
i. Compare the relative frequency histograms. What is the main difference between the distributions of batting averages in the two leagues?
Step by Step Answer:


