

Question: The following relative frequency histogram presents the average temperatures, in F, for each of the 50 states of the United States, plus the District of
The following relative frequency histogram presents the average temperatures, in °F, for each of the 50 states of the United States, plus the District of Columbia.
Use the histogram to answer the following questions.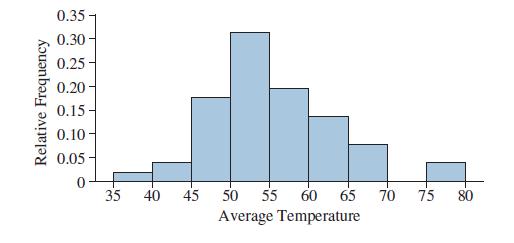
a. In which interval are the largest number of states?
b. Is the percentage of states with average temperatures above 60° closest to 30%, 40%, or 50%?
c. In which interval are there more states, 55–60 or 60–70?
Relative Frequency 0.35- 0.30- 0.25 0.20- 0.15 0.10- 0.05- 0 35 40 45 50 55 60 65 70 75 80 Average Temperature
Step by Step Solution
★★★★★
3.33 Rating (150 Votes )
There are 3 Steps involved in it
1 Expert Approved Answer
Step: 1 Unlock

Question Has Been Solved by an Expert!
Get step-by-step solutions from verified subject matter experts
Step: 2 Unlock
Step: 3 Unlock