

The following table presents interest rates, in percent, for 30-year and 15-year fixed-rate mortgages, for January through
Question:
The following table presents interest rates, in percent, for 30-year and 15-year fixed-rate mortgages, for January through December, 2012.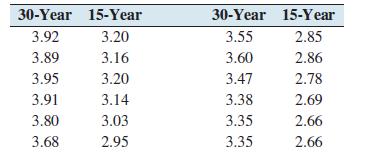
a. Compute the least-squares regression line for predicting the 15-year rate from the 30-year rate.
b. Construct a scatterplot of the 15-year rate (y) versus the 30-year rate (x). Graph the least-squares regression line on the same axes.
c. Is it possible to interpret the y-intercept? Explain.
d. If the 30-year rate differs by 0.3 percent from one month to the next, by how much would you predict the 15-year rate to differ?
e. Predict the 15-year rate for a month when the 30-year rate is 3.5 percent.
Step by Step Answer:

This question has not been answered yet.
You can Ask your question!
Related Book For 

Question Posted:
