

The following table presents math and verbal SAT scores for six freshmen. a. Compute the correlation coefficient
Question:
The following table presents math and verbal SAT scores for six freshmen.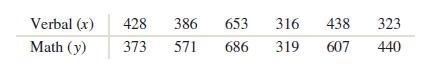
a. Compute the correlation coefficient between math and verbal SAT score.
b. Compute the mean x̄ and the standard deviation sx for the verbal scores.
c. Compute the mean ȳ and the standard deviation sy for the math scores.
d. Compute the least-squares regression line for predicting math score from verbal score.
e. Compute the z-score for each x-value:![]()
f. Compute the z-score for each y-value:![]()
g. Compute the correlation coefficient r between zx and zy. Is it the same as the correlation between math and verbal SAT scores?
h. Compute the least-squares regression line for predicting zy from zx. Explain why the equation of the line is ̂zy = r zx.
Fantastic news! We've Found the answer you've been seeking!
Step by Step Answer:

Answered By
Muhammad Umair
I have done job as Embedded System Engineer for just four months but after it i have decided to open my own lab and to work on projects that i can launch my own product in market. I work on different softwares like Proteus, Mikroc to program Embedded Systems. My basic work is on Embedded Systems. I have skills in Autocad, Proteus, C++, C programming and i love to share these skills to other to enhance my knowledge too.
1+ Reviews
10+ Question Solved
Related Book For 

Question Posted:
