

The following time-series plot presents the amount spent, in billions of dollars, on dining out by U.S.
Question:
The following time-series plot presents the amount spent, in billions of dollars, on dining out by U.S. residents for the years 1997–2014.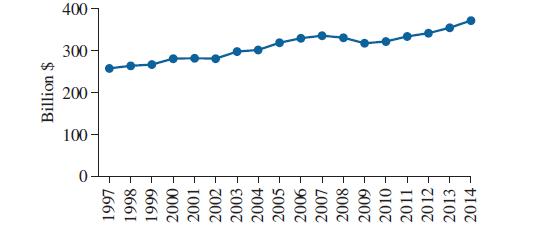
a. Estimate the amount spent on dining out in 2003.
b. Was the amount spent in 2005 greater than, less than, or about the same as the amount spent in 2009?
c. True or false: The amount spent in 2014 is approximately twice as much as the amount spent in 1997.
d. In 2008, an economic downturn known as the Great Recession occurred. What was the effect on the amount of money spent on dining out?
Step by Step Answer:

This question has not been answered yet.
You can Ask your question!
Related Book For 

Question Posted:
