

The town of Libby, Montana, has experienced high levels of air pollution in the winter because many
Question:
The town of Libby, Montana, has experienced high levels of air pollution in the winter because many of the houses in Libby are heated by wood stoves that produce a lot of pollution. In an attempt to reduce the level of air pollution in Libby, a program was undertaken in which almost every wood stove in the town was replaced with a newer, cleaner-burning model.
Measurements of several air pollutants were taken both before and after the stove replacement. They included particulate matter (PM), total carbon (TC), organic carbon (OC), which is carbon bound in organic molecules, and levoglucosan (LE), which is a compound found in charcoal and is thus an indicator of the amount of wood smoke in the atmosphere.
In order to determine how much the pollution levels were reduced, scientists measured the levels of these pollutants for three winters prior to the replacement. The mean levels over this period of time are referred to as the baseline levels. Following are the baseline levels for these pollutants. The units are micrograms per cubic meter.![]()
The following table presents values measured on samples of winter days during the two years following replacement.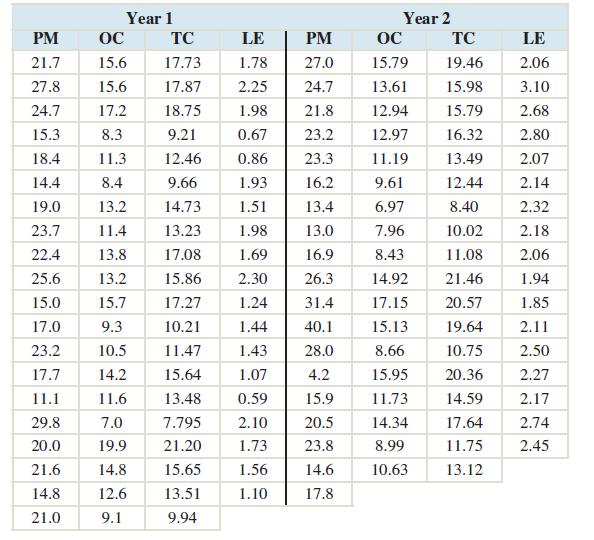
1. For each of the four pollutants, construct a boxplot for the values for Year 1 to verify that the assumptions for constructing a confidence interval are satisfied.
2. Construct a 95% confidence interval for the mean level of each pollutant for the Year 1.
3. Is it reasonable to conclude that the mean levels in Year 1 were lower than the baseline levels for some or all of the pollutants? Which ones, if any?
The investigators were concerned that the reduction in pollution levels might be only temporary. Specifically, they were concerned that people might use their new stoves carefully at first, thus obtaining the full advantage of their cleaner burning, but then become more casual in their operation, leading to an increase in pollution levels. We will investigate this issue by constructing confidence intervals for the mean levels in Year 2.
4. Repeat Exercises 1 and 2 for the Year 2 data.
5. Is it reasonable to conclude that the mean levels in Year 2 were lower than the baseline levels for some or all of the pollutants? Which ones, if any?
Step by Step Answer:


