

Question: Use the data in Exercise 24 in Section 13.1 for the following. a. Compute a point estimate for the mean auditory response time for subjects
Use the data in Exercise 24 in Section 13.1 for the following.
a. Compute a point estimate for the mean auditory response time for subjects with a visual response time of 200.
b. Construct a 99% confidence interval for the mean auditory response time for subjects with a visual response time of 200.
c. Predict the auditory response time for a particular subject whose visual response time is 200.
d. Construct a 99% prediction interval for the auditory response time for a particular subject whose visual response time is 200.
Exercise 24
In a study of reaction times, the time to respond to a visual stimulus (x) and the time to respond to an auditory stimulus (y) were recorded for each of 10 subjects. Times were measured in thousandths of a second. The results are presented in the following table.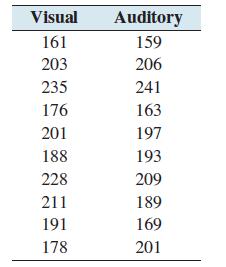
Visual Auditory 161 159 203 206 235 241 176 163 201 197 188 193 228 209 211 189 191 169 178 201
Step by Step Solution
3.52 Rating (159 Votes )
There are 3 Steps involved in it

Get step-by-step solutions from verified subject matter experts