

Question: Using the data in Exercise 19: a. Construct a frequency distribution for the total number of smartphones sold in each of the four quarters Jan.Mar.,
Using the data in Exercise 19:
a. Construct a frequency distribution for the total number of smartphones sold in each of the four quarters Jan.–Mar., Apr.–Jun., Jul.–Sep., and Oct.–Dec.
b. Construct a frequency bar graph.
c. Construct a relative frequency distribution.
d. Construct a relative frequency bar graph.
e. Construct a pie chart.
f. True or false: More than half of smartphones were sold between October and December.
Exercise 19
The following frequency distribution presents the number of smartphones (in millions) shipped in each quarter of each year from 2012 through 2015.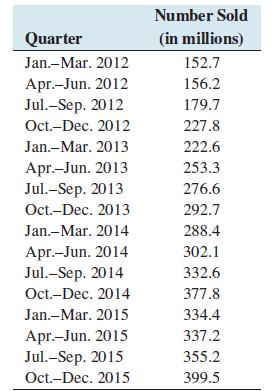
Quarter Number Sold (in millions) Jan.-Mar. 2012 152.7 Apr.-Jun. 2012 156.2 Jul.-Sep. 2012 179.7 Oct.-Dec. 2012 227.8 Jan.-Mar. 2013 222.6 Apr.-Jun. 2013 253.3 Jul.-Sep. 2013 276.6 Oct.-Dec. 2013 292.7 Jan.-Mar. 2014 288.4 Apr.-Jun. 2014 302.1 Jul.-Sep. 2014 332.6 Oct.-Dec. 2014 377.8 Jan.-Mar. 2015 334.4 Apr.-Jun. 2015 337.2 Jul.-Sep. 2015 355.2 Oct.-Dec. 2015 399.5
Step by Step Solution
3.41 Rating (154 Votes )
There are 3 Steps involved in it

Get step-by-step solutions from verified subject matter experts