

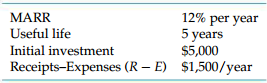
Question: Answer the problem on the basis of the given graph and the most likely estimates given as follows: Graph: If the initial investment is increased
Graph:
If the initial investment is increased by more than 9%, the project is profitable.
(a) True
(b) False
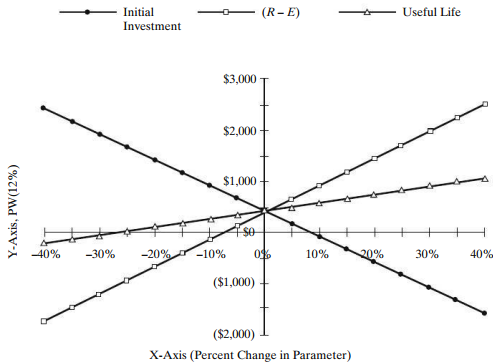
12% per year 5 years MARR Useful life Initial investment Receipts-Expenses (R $5,000 E) $1,500/year Initial (R-E) Useful Life Investment $3,000 $2,000 $1,000 se -40% -30% -20% -10% 10% 20% 30% 40% ($1,000) - ($2,000) X-Axis (Percent Change in Parameter) Y-Axis, PW(12%)
Step by Step Solution
★★★★★
3.46 Rating (179 Votes )
There are 3 Steps involved in it
1 Expert Approved Answer
Step: 1 Unlock

Question Has Been Solved by an Expert!
Get step-by-step solutions from verified subject matter experts
Step: 2 Unlock
Step: 3 Unlock