

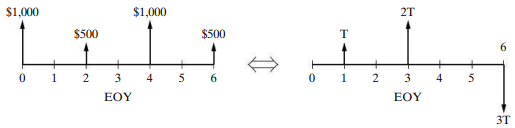
What value of T makes these two cash flow diagrams (see Figure P4-74) economically equivalent at 8%
Question:
Figure P4-74:
Fantastic news! We've Found the answer you've been seeking!
Step by Step Answer:
We can solve for T by equating the P 0 equival...View the full answer

Answered By
Susan Juma
I'm available and reachable 24/7. I have high experience in helping students with their assignments, proposals, and dissertations. Most importantly, I'm a professional accountant and I can handle all kinds of accounting and finance problems.
15+ Reviews
45+ Question Solved
Related Book For 
Engineering Economy
ISBN: 978-0133439274
16th edition
Authors: William G. Sullivan, Elin M. Wicks, C. Patrick Koelling
Question Posted:
