

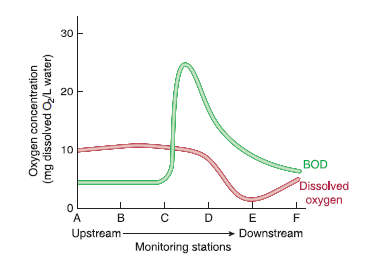
The graph reflects the monitoring of dissolved oxygen concentrations at six stations along a river. The stations
Question:
Fantastic news! We've Found the answer you've been seeking!
Step by Step Answer:
The spill happene...View the full answer

Answered By
Anjali Arora
Having the experience of 16 years in providing the best solutions with a proven track record of technical contribution and appreciated for leadership in enhancing team productivity, deliverable quality, and customer satisfaction. Expertise in providing the solution in Computer Science, Management, Accounting, English, Statistics, and Maths.
Also, do website designing and Programming.
Having 7 yrs of Project Management experience.
100% satisfactory answers.
3+ Reviews
10+ Question Solved
Related Book For 
Environment
ISBN: 978-1118875827
9th edition
Authors: Peter H. Raven, David M. Hassenzahl, Mary Catherine Hager, Nancy Y. Gift, Linda R. Berg
Question Posted:
