

Question: Answer the questions below using the information provided in the figure. Note: the MCC and MDC are drawn as a straight line to make the
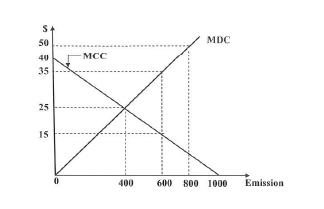
Answer the questions below using the information provided in the figure. Note: the MCC and MDC are drawn as a straight line to make the numerical computations simple. You should also be reminded that the area under a curve (represents total cost) and the area of a triangle are computed by using the formula: \(1 / 2\) (base \(\times\) height),
a) What will be the total damage cost if a decision is made to clean-up only 200 units of waste? Show your work
b) What will be the total control cost if polluters are required to clean-up 400 units of waste emissions? Show your work.
c) At the 600 level of waste emission, the corresponding value of the marginal damage cost is \(\$ 35\). What exactly does this value tell us? Be specific.
d) Again, at the 600 level of waste emission, the corresponding value of the marginal control cost is \(\$ 15\). What exactly does this value tell us? Be specific.
e) The "optimal" level of pollution is achieved at an emission level of 400 units where MDC = MCC. Compute the total damage and the total control costs at this optimal point? Can you show that the SUM of the total damage and control costs at the optimal level of emission is smaller than at any other point in the graph (for example, if the emission is 600 units)? Is this what economists mean when they say that the optimal level of pollution is cost-effective? Explain.
S 50 40 35 25 15 MCC 400 MDC 600 800 1000 Emission
Step by Step Solution
3.36 Rating (146 Votes )
There are 3 Steps involved in it

Get step-by-step solutions from verified subject matter experts