

Of the plans you graphed in Problems 6 and 7, rank them in order from best to
Question:
Of the plans you graphed in Problems 6 and 7, rank them in order from best to worst in their ability to promote efficient resource use. Which of these plans most closely resembles the pricing plan you face for water?
Which most closely resembles the pricing plan you face for oil? Discuss why these pricing plans might be in place.
Problems 6
Draw a graph with the price per unit on the vertical axis and the number of units purchased on the horizontal axis. Draw the relationship between per-unit price and quantity for each of the following plans on the same graph: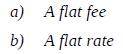
Problems7
Draw another graph with the price per unit on the vertical axis and the number of units purchased on the horizontal axis. Draw the relationship between price and quantity for each of the following plans on the same graph: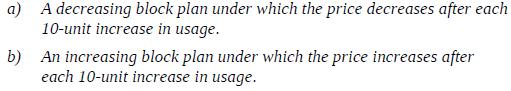
Step by Step Answer:

This question has not been answered yet.
You can Ask your question!

Environmental Economics And Natural Resource Management
ISBN: 9780415640954
4th Edition
Authors: David A. Anderson
