

When setting standards for lead in drinking water, the EPA considered three options illustrated in Table 4.3.
Question:
When setting standards for lead in drinking water, the EPA considered three options illustrated in Table 4.3. The symbol μg/l stands for micrograms (millionths of a gram)
per liter. Standard A, the most strict standard, would require municipal systems (small and large in size) to take action if lead levels were greater than 5 μg/l; B relaxed the action level for small municipal systems to 15 μg/l; and C set a standard for both small and large at 15 μg/l.
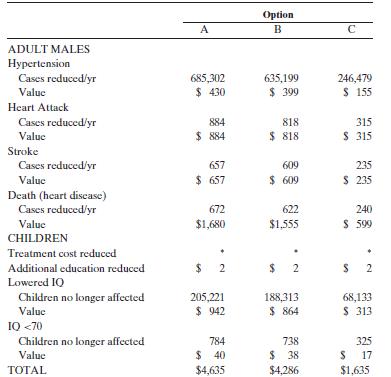
The EPA undertook a benefit-cost analysis of the proposed standards as part of a Regulatory Impact Assessment. The final results are reproduced in Tables 4.4 and 4.5.
(Note, there are eight questions listed. Questions 5–8 follow some additional text.)
1. What are the net benefits of the three options? Which option is the most efficient? Is there a conflict between safety and efficiency here?
2. The marginal benefit of option A ($5,192) in the fourth line of the table is derived from the total benefit values listed in the first line of the table. How is this number calculated?
Table 4.3
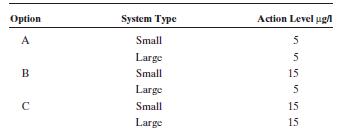
Table 4.4
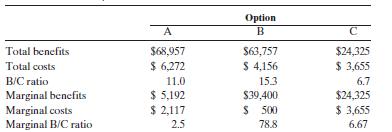
Table 4.5
3. The marginal benefits and costs for option C are measured relative to a no regulation baseline. Are the MB > MC for option C? Option B? Option A?
Does this result contradict your answer to part 1?
4. Option B has the biggest benefit/cost ratio. Does this contradict your answer to part 1?
Lead is a well-known neurotoxin. Some credit lead in drinking water to contributing to the downfall of the Roman empire! Lead also has additional health impacts. Table 4.6 illustrates the impacts the EPA tried to take into account. However, the agency was able to quantify and include in the benefits line of the table less than half of these impacts (marked with an *).
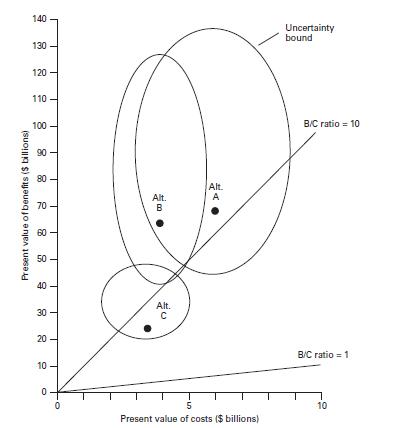
Given this, and the myriad uncertainty associated with the benefits it did measure, the EPA authors “assume,” based on “professional judgment,” that the “true” benefit measure could be up to two times as high, or 70% below, the actual value their estimation procedure generated. The EPA argued that there was a similar uncertainty band around their estimate costs. To better reflect this uncertainty, the EPA included Figure 4.9 in the analysis.
5. Given the uncertainty, do all three options pass a test such that B > C?
6. Given the uncertainty, can one really tell if option A is more efficient than B?
How about option A relative to C?
7. Does the table showing the final results of the benefit-cost analysis illustrate the “hard numbers illusion”?
8. If you were in charge of deciding, would you pick option A or B? Why?
Table 4.6
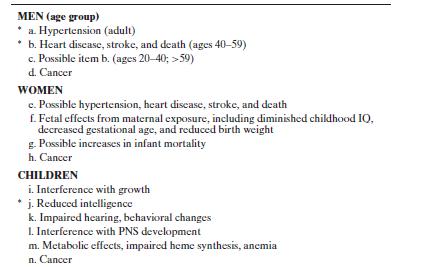
Figure 4.9
Step by Step Answer:


Economics And The Environment
ISBN: 9781118539729
7th Edition
Authors: Eban S. Goodstein, Stephen Polasky
