Exhibit 26 shows the values of the S&P 500 and three exchange-traded funds (ETFs) for the end
Question:
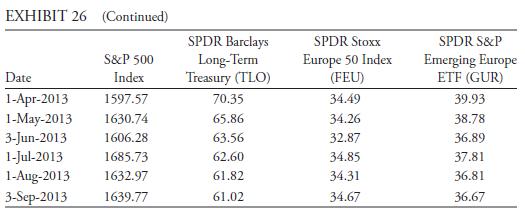
Exhibit 26 shows the values of the S&P 500 and three exchange-traded funds (ETFs)
for the end of each of 18 months from April 2012 through September 2013. The ETFs are for long-term US Treasury securities, the STOXX Europe 50 Index, an emerging Europe SPDR. SPDR stands for Standard & Poor’s Depositary Receipt.
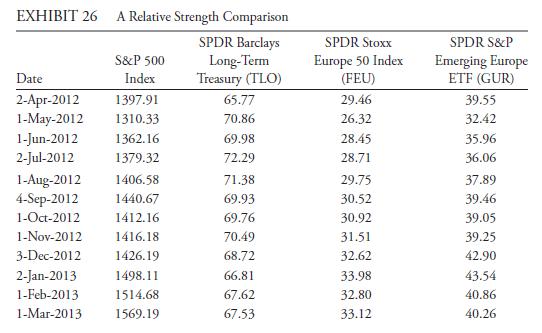
To produce the information for Exhibit 27, we divided each ETF value by the S&P 500 value for the same month and then scaled those results so that the value of the relative-strength indicator (RSTR) for April 2012 would equal 1.0. To illustrate, on 2 April 2012, the value of TLO divided by the S&P 500 was 65.77/1,397.91 = 0.0470.
The RSTR for TLO on that date, by design, is then 0.0470/0.0470 = 1.0. In May, the value of TLO divided by the S&P 500 was 70.86/1,310.33 = 0.0541, which we scaled by the April number. The RSTR for 1 May 2012 for GLD is 0.0541/0.0470 = 1.1494, shown in Exhibit 27 as 1.149.
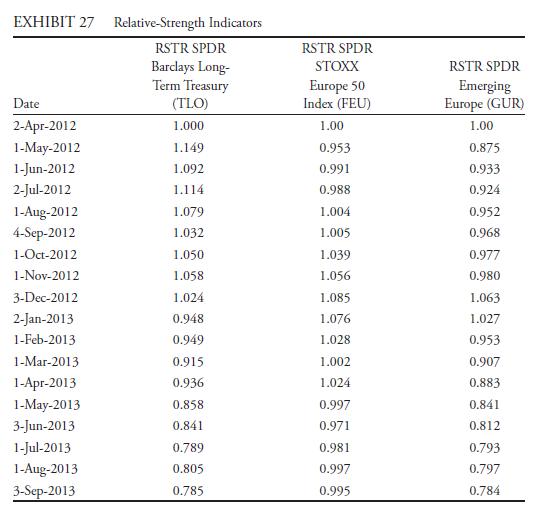
On the basis of Exhibits 26 and 27, address the following:
i. State the relative strength of long-term US Treasury securities, STOXX Europe 50 Index, and emerging Europe stocks over the entire time period April 2012 through September 2013. Interpret the relative strength for each sector over that period.
ii. Discuss the relative performance of the STOXX Europe 50 Index ETF and the emerging Europe ETF in the period ending 3 December 2012.
Step by Step Answer:
i The relativestrength indicator for longterm US Treasuries is 0785 This number represents 0785 100...View the full answer