

Question: Download the full data set from the McGraw-Hill Connect? website (only six data values are shown). (a) Use Excel to make a scatter plot, placing
Download the full data set from the McGraw-Hill Connect? website (only six data values are shown).
(a) Use Excel to make a scatter plot, placing Dolona on the X-axis and ZalParm on the Y-axis. Add titles and modify the default colors, fonts, etc., as you judge appropriate to make the scatter plot effective.
(b) Describe the relationship (if any) between X and Y. Weak? Strong? Negative? Positive? Linear? Nonlinear?
(c) Make a line chart showing both time series variables on the same chart. Does the line chart support your conclusions from the scatter plot?
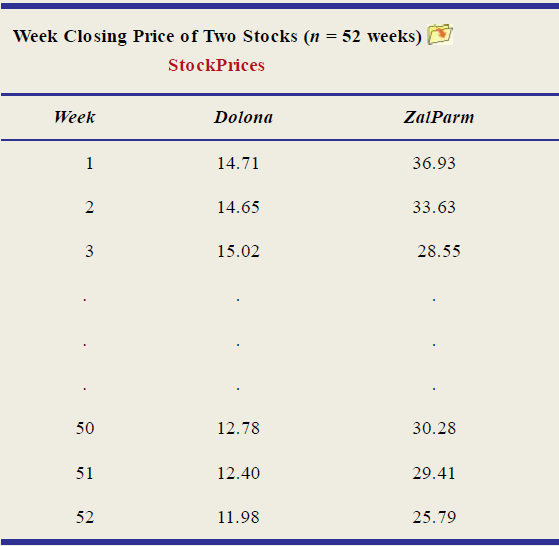
Week Closing Price of Two Stocks (n = 52 weeks) StockPrices Week Dolona ZalParm 36.93 14.71 2 14.65 33.63 15.02 28.55 30.28 50 12.78 51 12.40 29.41 25.79 52 11.98
Step by Step Solution
3.35 Rating (176 Votes )
There are 3 Steps involved in it
a b There is a strong positive relationship between Dolana and ZalPar... View full answer

Get step-by-step solutions from verified subject matter experts