

The graph shows the heights for a large group of adults. Describe the distribution, and explain what
Question:
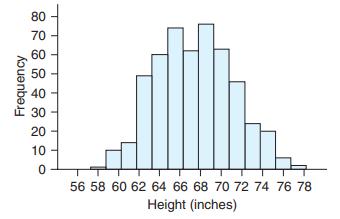
The graph shows the heights for a large group of adults. Describe the distribution, and explain what might cause this shape.
Fantastic news! We've Found the answer you've been seeking!
Step by Step Answer:
The graph is bimodal with modes ...View the full answer

Answered By
Muhammad Umair
I have done job as Embedded System Engineer for just four months but after it i have decided to open my own lab and to work on projects that i can launch my own product in market. I work on different softwares like Proteus, Mikroc to program Embedded Systems. My basic work is on Embedded Systems. I have skills in Autocad, Proteus, C++, C programming and i love to share these skills to other to enhance my knowledge too.
1+ Reviews
10+ Question Solved
Related Book For 

Essential Statistics
ISBN: 9780134134406
2nd Edition
Authors: Robert Gould, Colleen N. Ryan, Rebecca Wong
Question Posted:
