

Question: 17. In Chapter 6, Problem 21 (p. 152), data were given on the relationship between the number of soft drinks consumed in a week by
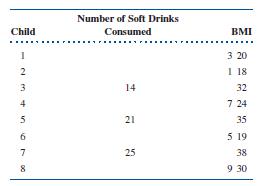
17. In Chapter 6, Problem 21 (p. 152), data were given on the relationship between the number of soft drinks consumed in a week by eight 12-year-olds and their body mass index (BMI). The 12-year-olds were randomly selected from a junior high school in a large northwestern city. The data are again presented here.
a. Assuming the data show a linear relationship, derive the least-squares regression line for predicting BMI, given the number of soft drinks consumed.
b. Using this regression line, what BMI would you predict for a 12-year-old from this school who consumes a weekly average of 17 soft drinks?
health
Child 1 Number of Soft Drinks Consumed 2 3 14 4 5 21 6 7 25 8 BMI 3 20 118 32 7 24 35 5 19 38 9 30
Step by Step Solution
There are 3 Steps involved in it

Get step-by-step solutions from verified subject matter experts