

Question: 5.26 Merlins breeding. Exercise 4.36 (page 89) gives data on the number of breeding pairs of merlins in an isolated area in each of nine
5.26 Merlins breeding. Exercise 4.36 (page 89) gives data on the number of breeding pairs of merlins in an isolated area in each of nine years and the percent of males who returned the next year. The data show that the percent returning is lower after successful breeding seasons and that the relationship is roughly linear. Figure 5.9 shows Minitab regression output for these data.
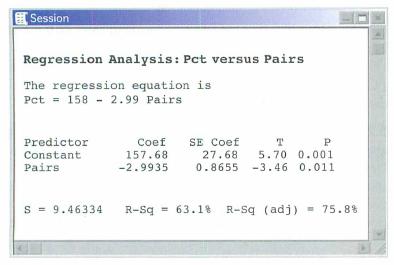
(a) What is the equation of the least-sciuares regression line for predicting the percent of males that return from the num ber of breeding pairs? Use the equation to predict the percent of returning males after a season with 30 breeding pairs, (h) What percent of the year-to-year variation in percent of returning males is explained by the straight-line relationship with number of breeding pairs the previous year?
(c) Use the information in Figure 5.9 to find the correlation r between percent of males that return and number of breeding pairs. How do you know whether the sign of r is + or — ?
Session Regression Analysis: Pct versus Pairs The regression equation is Pct 158 2.99 Pairs Predictor Constant Pairs S = 9.46334 Coef SE Coef T P 157.68 27.68 5.70 0.001 -2.9935 0.8655 -3.46 0.011 R-Sq63.18 R-Sq (adj) = 75.8%
Step by Step Solution
There are 3 Steps involved in it

Get step-by-step solutions from verified subject matter experts