

Question: Standard electrocardiography measures time-dependent potential differences between multiple points on the body, giving cardiologists multiple perspectives on the heart?s electrical activity. In contrast, Fig. 22.26
Standard electrocardiography measures time-dependent potential differences between multiple points on the body, giving cardiologists multiple perspectives on the heart?s electrical activity. In contrast, Fig. 22.26 is a ?snapshot? showing a more detailed picture at an instant of time. The lines are equipotentials on the surface of a human torso, associated with the heart?s electrical activity. Relative to the line marked V = 0, the potential is negative to the upper left (black) and positive to the lower right (color).
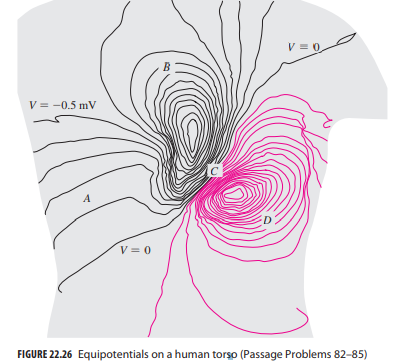
The electric field is strongest in the region marked
a. A.b. B.c. C.d. D.
V = 0 V = -0.5 mV V= 0 FIGURE 22.26 Equipotentials on a human toro (Passage Problems 82-85)
Step by Step Solution
3.49 Rating (156 Votes )
There are 3 Steps involved in it
A The electric field is strongest in the region marked A The equipotential lin... View full answer

Get step-by-step solutions from verified subject matter experts