

Question: Using the table below, make a plot of atomic volume versus atomic number, for the elements from Z = 30 to Z = 59 listed
Using the table below, make a plot of atomic volume versus atomic number, for the elements from Z = 30 to Z = 59 listed in the table. Comment on the structure of your graph in relation to the periodic table, the electronic structures of atoms, and their chemical properties. (Volumes are in units of 10-30 m3 .)
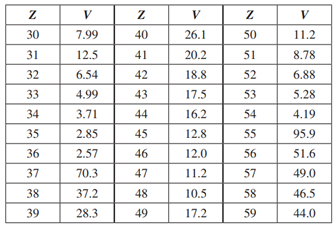
V V V 30 7.99 40 26.1 50 11.2 31 12.5 41 20.2 51 8.78 32 6.54 42 18.8 52 6.88 33 4.99 43 17.5 53 5.28 34 3.71 44 16.2 54 4.19 35 2.85 45 12.8 55 95.9 36 2.57 46 12.0 56 51.6 37 70.3 47 11.2 57 49.0 38 37.2 48 10.5 58 46.5 39 28.3 49 17.2 59 44.0
Step by Step Solution
3.31 Rating (160 Votes )
There are 3 Steps involved in it
based on the data given in the table the graph of atomic volume versus atomic number for elements from Z 30 to Z 59 would display a generally decreasi... View full answer

Get step-by-step solutions from verified subject matter experts