

Question: 2. (LO 1.6) Is the data visualization shown in Exercise 1 better or worse than the same data in the following tabular format? Explain. Labor
2. (LO 1.6) Is the data visualization shown in Exercise 1 better or worse than the same data in the following tabular format? Explain.
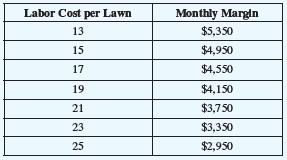
Labor Cost per Lawn Monthly Margin 13 $5,350 15 $4,950 17 $4,550 19 $4,150 21 $3,750 23 $3,350 25 $2,950
Step by Step Solution
There are 3 Steps involved in it
1 Expert Approved Answer
Step: 1 Unlock

Question Has Been Solved by an Expert!
Get step-by-step solutions from verified subject matter experts
Step: 2 Unlock
Step: 3 Unlock