

Question: 4. (LO 6.3) Examine the data visualization below. Is it a histogram or a bar chart? How can you tell? Total Sales ($) 2,000,000 1,500,000
4. (LO 6.3) Examine the data visualization below. Is it a histogram or a bar chart? How can you tell?
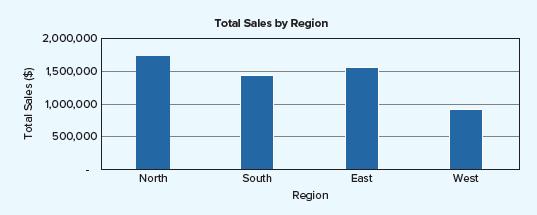
Total Sales ($) 2,000,000 1,500,000 1,000,000 Total Sales by Region 500,000 North South East West Region
Step by Step Solution
There are 3 Steps involved in it
1 Expert Approved Answer
Step: 1 Unlock

Question Has Been Solved by an Expert!
Get step-by-step solutions from verified subject matter experts
Step: 2 Unlock
Step: 3 Unlock