

Question: A simple linear regression, y = ? 0 + ? 1 x + ?, is estimated with cross-sectional data. The resulting residuals e along with
A simple linear regression, y = ?0 + ?1x + ?, is estimated with cross-sectional data. The resulting residuals e along with the values of the explanatory variable x are shown in the accompanying table.
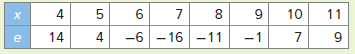
a. Graph the residuals e against the values of the explanatory variable x and look for any discernible pattern.
b. Which assumption is being violated? Discuss its consequences and suggest a possible remedy.
11 4. 10 8. 4 14 -6 -6 - 16 -11 -1 -1
Step by Step Solution
3.37 Rating (175 Votes )
There are 3 Steps involved in it
a b Since the residual plot exhibits nonlinear patterns the ... View full answer

Get step-by-step solutions from verified subject matter experts