

Refer to the observed capital structures given in Table 15.3 of the text. What do you notice
Question:
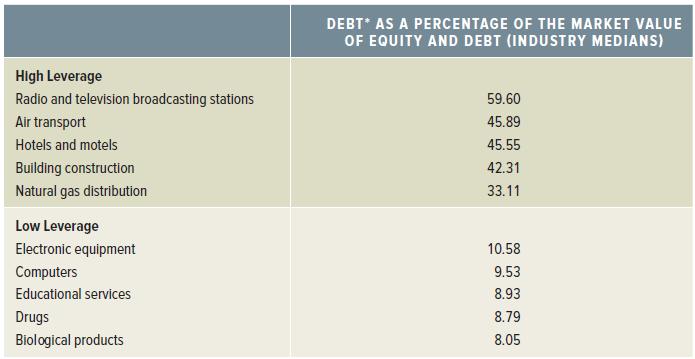
Refer to the observed capital structures given in Table 15.3 of the text. What do you notice about the types of industries with respect to their average debt–equity ratios? Are certain types of industries more likely to be highly leveraged than others? What are some possible reasons for this observed segmentation? Do the operating results and tax history of the firms play a role? How about their future earnings prospects? Explain.
Table 15.3
Fantastic news! We've Found the answer you've been seeking!
Step by Step Answer:
According to Table 153 industries with higher average debtequity ratios include radio and television ...View the full answer

Answered By
Dulal Roy
As a tutor, I have gained extensive hands-on experience working with students one-on-one and in small group settings. I have developed the ability to effectively assess my students' strengths and weaknesses, and to customize my teaching approach to meet their individual needs.
I am proficient at breaking down complex concepts into simpler, more digestible pieces, and at using a variety of teaching methods (such as visual aids, examples, and interactive exercises) to engage my students and help them understand and retain the material.
I have also gained a lot of experience in providing feedback and guidance to my students, helping them to develop their problem-solving skills and to become more independent learners. Overall, my hands-on experience as a tutor has given me a deep understanding of how to effectively support and encourage students in their learning journey.
0 Reviews
10+ Question Solved
Related Book For 
Corporate Finance Core Principles and Applications
ISBN: 978-1259289903
5th edition
Authors: Stephen Ross, Randolph Westerfield, Jeffrey Jaffe, Bradford Jordan
Question Posted:
