

A random sample of 100 college students was asked to rate their courses on a scale of
Question:
A random sample of 100 college students was asked to rate their courses on a scale of 1 to 10 (10 being best) and state their grade in the course on a scale of 1 to 12 (A = 12, A− = 11, and so on). The average rating was 5.53 and the average grade 9.69. A least squares regression of rating (Y) on grade (X) gave these results: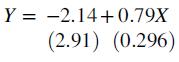
The standard errors are in parentheses.
a. What does a least squares regression tell us that a comparison of the average values, 5.53 versus 9.69, does not?
b. How do you interpret the estimate −2.14?
c. How do you interpret the estimate 0.79?
d. Is the estimated relationship between X and Y statistically significant at the 1 percent level?
e. Do you think that grades influence ratings or that ratings influence grades?
f. If so, what difference does it make to a regression equation?
Step by Step Answer:


Essential Statistics Regression And Econometrics
ISBN: 9780123822215
1st Edition
Authors: Gary Smith
