

Exercise 2.26 shows the percentage returns for the ten Dow stocks with the highest dividend/price (D/P) ratio
Question:
Exercise 2.26 shows the percentage returns for the ten Dow stocks with the highest dividend/price (D/P) ratio and the ten Dow stocks with the lowest D/P ratio. Display these data in two side-by-side boxplots. Do the data appear to have similar or dissimilar medians and dispersion?
Exercise 2.26
From the 30 stocks in the Dow Jones Industrial Average, students identified the ten stocks with the highest dividend/price (D/P) ratio and the ten stocks with the lowest D/P ratio. The percentage returns on each stock were then recorded over the next year (Table 2.12). Display these returns in two histograms using the same units on the horizontal axis. Do the data appear to have similar distributions?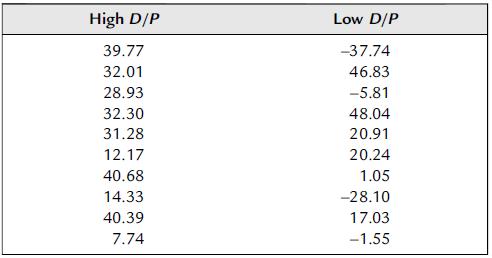
Step by Step Answer:


Essential Statistics Regression And Econometrics
ISBN: 9780123822215
1st Edition
Authors: Gary Smith
