

Table 2.10 shows the percentage of the Jewish population of various ages in Germany in 1928 and
Question:
Table 2.10 shows the percentage of the Jewish population of various ages in Germany in 1928 and in 1959 and of a theoretical stationary population that is neither growing nor contracting. Make three histograms, one for each population.
(Assume that the interval 60 and over is 60–79.) What conclusions can you draw from these graphs?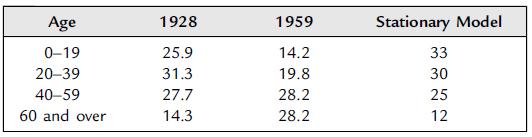
Step by Step Answer:

This question has not been answered yet.
You can Ask your question!
Related Book For 

Essential Statistics Regression And Econometrics
ISBN: 9780123822215
1st Edition
Authors: Gary Smith
Question Posted:
