

Table 8.1 shows average monthly U.S. housing starts (in thousands). Estimate a simple linear regression model where
Question:
Table 8.1 shows average monthly U.S. housing starts (in thousands). Estimate a simple linear regression model where the dependent variable is the number of housing starts and the explanatory variable is time, with t = 0 in 1960.
a. Interpret the value of the estimated slope.
b. Does the estimated slope have a two-sided P value less than 0.05?
c. State the null hypothesis in words, not symbols.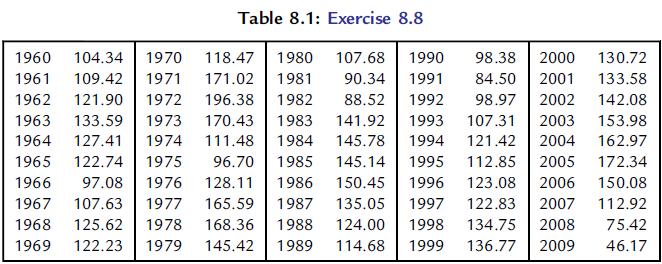
Fantastic news! We've Found the answer you've been seeking!
Step by Step Answer:

Answered By
Parvesh Kumar
I am an experienced Mathematics and Statistics tutor with 10 years of experience teaching students and working professionals. I love teaching students who are passionate to learn subjects or wants to understand any mathematics and statistics concept at graduation or master’s level. I have worked with thousands of students in my teaching career. I have helped students deal with difficult topics and subjects like Calculus, Algebra, Discrete Mathematics, Complex analysis, Graph theory, Hypothesis testing, Probability, Statistical Inference and more. After learning from me, students have found Mathematics and Statistics not dull but a fun subject. I can handle almost all curriculum of mathematics. I did B.Sc (mathematics), M.Sc (mathematics), M.Tech (IT) and am also Gate (CS) qualified. I have worked in various college and school and also provided online tutoring to American and Canadian students. I look forward to discussing with you and make learning a meaningful and purposeful
4+ Reviews
10+ Question Solved
Related Book For 

Essential Statistics Regression And Econometrics
ISBN: 9780123822215
1st Edition
Authors: Gary Smith
Question Posted:
