

Table 9.7 shows the SAT scores (6002400) and college GPAs (four-point scale) for 24 second-year college students
Question:
Table 9.7 shows the SAT scores (600–2400) and college GPAs (four-point scale) for 24 second-year college students at a highly selective college. Use a simple regression model to estimate the relationship between these variables. Explain your answers to these questions:
a. Which variable did you use as the dependent variable?
b. Is the relationship statistically significant at the 5 percent level?
c. Is the estimated relationship of any practical importance?
d. Do you think that your least squares equation can be used to make reliable GPA predictions for a student with a 1200 SAT score?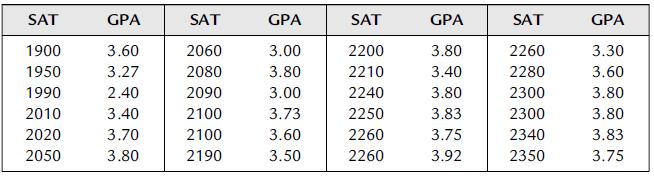
Fantastic news! We've Found the answer you've been seeking!
Step by Step Answer:

Answered By
Charles mwangi
I am a postgraduate in chemistry (Industrial chemistry with management),with writing experience for more than 3 years.I have specialized in content development,questions,term papers and assignments.Majoring in chemistry,information science,management,human resource management,accounting,business law,marketing,psychology,excl expert ,education and engineering.I have tutored in other different platforms where my DNA includes three key aspects i.e,quality papers,timely and free from any academic malpractices.I frequently engage clients in each and every step to ensure quality service delivery.This is to ensure sustainability of the tutoring aspects as well as the credibility of the platform.
2+ Reviews
10+ Question Solved
Related Book For 

Essential Statistics Regression And Econometrics
ISBN: 9780123822215
1st Edition
Authors: Gary Smith
Question Posted:
