

The Australian Bureau of Meteorology calculates the Southern Oscillation Index (SOI) from the monthly air pressure difference
Question:
The Australian Bureau of Meteorology calculates the Southern Oscillation Index
(SOI) from the monthly air pressure difference between Tahiti and Darwin, Australia.
Negative values of the SOI indicate an El Niño episode; positive values indicate a La Niña episode. Since 1989, Australia’s National Climate Center has used the SOI to predict rainfall 3 months in advance. A model was estimated [5] by least squares using 43 years of annual data on the wheat yield relative to the long-run upward trend (positive values indicate unusually high yields, negative readings unusually low yields) and the average SOI reading for June, July, and August (Australia’s winter). In these data, the average wheat yield is 0.000 and the average SOI reading is 0.267.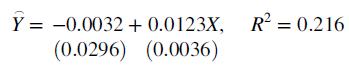
a. Which variable do you think is the dependent variable? Explain your reasoning.
b. Is the estimated slope statistically significant at the 5 percent level?
c. Are El Niño or La Niña episodes most often associated with high wheat yields?
Step by Step Answer:


Essential Statistics Regression And Econometrics
ISBN: 9780123822215
1st Edition
Authors: Gary Smith
